Unlocking The Secrets of Acceptable Survey Response Rates
Determining the right survey response rate is crucial for gathering meaningful customer feedback. It's not just about a percentage; it's about ensuring your data is statistically significant and representative of your audience. This guide cuts through the confusion, providing you with the knowledge to calculate and achieve a valid response rate for your surveys.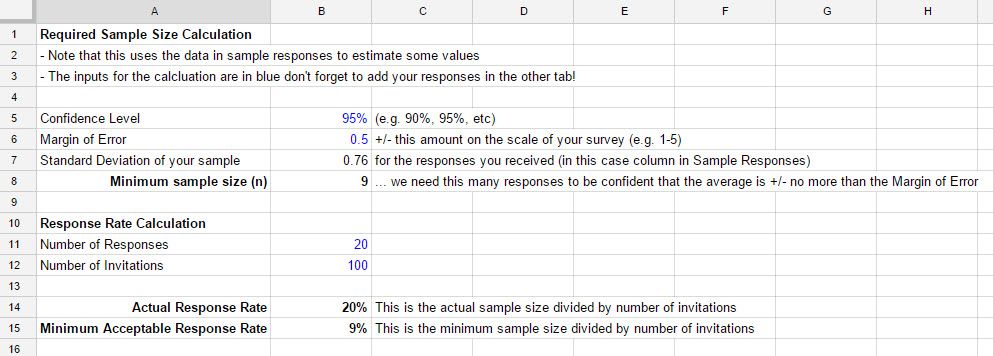
We'll explore how to calculate response rates, understand industry benchmarks, discuss the impact of sample bias, and provide actionable steps to improve your survey data's reliability. Whether you're using Net Promoter Score (NPS) or other customer feedback methods, this guide will equip you with the insights needed to make informed decisions.
How To Calculate Your Survey Response Rate
Calculating your survey response rate is straightforward. It involves two key variables: the number of invitations sent and the number of completed responses received.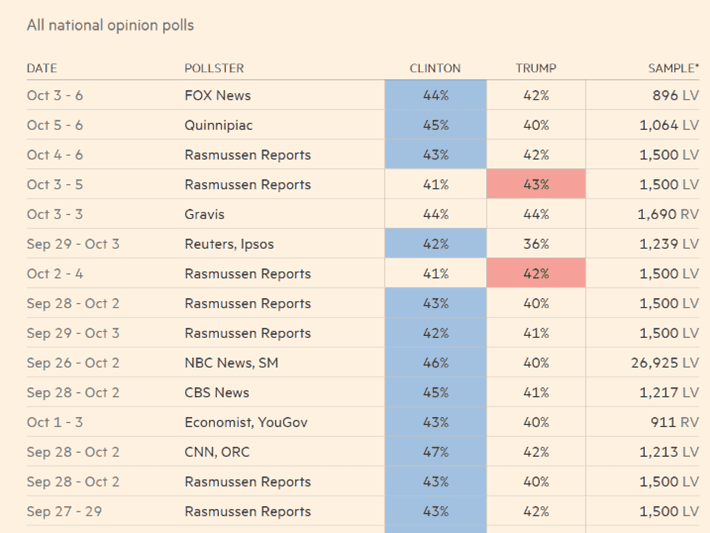
The formula is: (Number of Responses / Number of Invitations) * 100 = Response Rate. For example, if you invite 100 people and receive 25 responses, your response rate is 25%. It's important to note that partially completed responses can sometimes be included if they provide valuable data.
What is A Good Survey Response Rate?
A 'good' survey response rate depends on the survey type and industry. However, generally, a response rate above the average is considered desirable. Industry data offers benchmarks to help gauge your performance.
Email surveys typically have an average response rate around 25%, with well-crafted surveys often achieving between 10% and 30% depending on audience engagement. For NPS surveys, a good response rate is around 20% or higher. Remember that the total number of responses is more important than just the percentage in many cases.
Tools like the CustomerGauge NPS Benchmarks Survey can help compare your response rates against industry standards.
“The total number of responses is often more important than the response rate percentage.
Adam Ramshaw
Ensuring Statistically Valid Response Rates
To determine statistically valid response rates, understanding concepts such as margin of error and confidence intervals is key. Margin of Error indicates the range within which you're confident the population mean lies, while Confidence Interval defines this range.
The formula for Margin of Error is: Standard Error * Z (value related to the confidence level). Confidence Interval is calculated as: Mean +/- Margin of Error. These concepts help determine how many responses are needed for the data to be reliable.
Defining An Acceptable Survey Response Rate
An acceptable survey response rate is one that allows you to make informed business decisions based on the survey data. This rate varies dramatically depending on the variables impacting the minimum sample size needed. Factors to consider include:
1. The level of confidence desired in the results (e.g., 90% or 95% confidence).
2. The size of the changes you want to detect.
3. The inherent variation within your target population.
The number of responses required is what drives the minimum acceptable response rate.
Enhance Your Survey Strategy
Tools and Resources to Improve Your Surveys
Response Rate Calculator
Use our interactive calculator to determine your required sample size and acceptable response rate.
Survey Best Practices Checklist
Download our checklist for designing effective surveys to boost response rates and improve data quality.
Survey Template
Download a ready-made survey template and customize it to make your surveys better.
Calculating An Acceptable Survey Response Rate - Practical Example
To find the minimum responses needed to give a maximum error, the following formula is used to determine an acceptable survey response rate:
Let's say you want to be 95% certain that your average score is within +/- 0.5 on a 1-5 scale. In this example, you would need a minimum of 9 responses, making an acceptable response rate of 9% in this specific case.
Downloadable calculators and tools are available to help you do these calculations easily.
“An acceptable survey response rate allows you to make decisions.
This Guide
When Low Survey Response Rates Aren't Always Bad
A low response rate doesn't always equal invalid results. If your target population is very large, a small percentage of responses can still give you a substantial number of actual responses, leading to useful insights.
Political polling provides a prime example, where a tiny percentage of voters surveyed (like 0.0011%) can generate useful data to predict election results, especially when you're dealing with very large populations.
Understanding Sample Bias and Acceptable Response Rates
Survey sample bias can introduce systematic errors, making your sample unrepresentative of the wider population. It's important to identify and minimize this bias to ensure data validity. It can happen during the sampling process for many reasons.
Non-Response Bias Examples: Customers not having the same ability to respond, or not responding at the same rate.
Selection Bias Examples: Not all customers having an equal opportunity to be invited, like intentional errors entered by contact center staff on unhappy customer records to prevent surveys from being sent.